
Ask questions in plain English
Ask about revenue, labour cost, marketing spend, guest experience or attendance and get an answer drawn from your connected venue data.
Connect ticketing, labour, marketing and finance data into an always-current venue model that Claude can query in plain English, then turn verified answers into reports, dashboards and scheduled updates.
 AI analysis platform
Claude can query connected venue information, explain the numbers in plain English and help teams turn trusted answers into repeatable reporting workflows.
Venue groups run on disconnected systems across ticketing, labour, marketing and finance. Building one report everyone trusts usually means exporting, reconciling and hoping the numbers still match by the time anyone reads them.
Smart Segments connects those systems into an accurate, always-current data warehouse. Claude can query that context through the Smart Segments connector, so answers come from the real numbers your venues already run on.
Use Claude to explore the numbers, preserve the logic behind them and make the next report repeatable.
Ask about revenue, labour cost, marketing spend, guest experience or attendance and get an answer drawn from your connected venue data.
Check every report against the real financial data your teams already rely on before it reaches a manager, owner or leadership meeting.
Claude can study your real reports, learn how your numbers are calculated and save that logic as a reusable Skill for consistent future answers.
Save, share and revisit dashboards and reports that stay useful over time instead of taking another screenshot every time someone asks.
Set up a scheduled report that checks yesterday’s numbers, updates a dashboard and publishes a fresh file to the right place automatically.
These are practical examples drawn from the TreeClimb Group customer story. The right model depends on the systems and operating context available to your venues.
Give venue managers and ownership the same current view of revenue, labour cost and attendance across the group.
Query ticketing and attendance data conversationally instead of waiting for another export or rebuilding a spreadsheet.
Track group performance against budget with a report that keeps the relevant venue and financial context together.
Reverse-engineer reporting logic against Finance-reported P&Ls until the figures match the numbers your business trusts.
Turn a useful answer into a dashboard that operators, venue managers and ownership can save, share and revisit.
Publish a fresh report file each morning to the right folder so the latest performance view is ready without spreadsheet work.
TreeClimb runs four adventure park venues across Australia. Jake Cunningham built Claude-powered dashboards on Smart Segments so everyone from the venue manager on the ground to ownership can see the same live view of revenue, labour cost, guest experience and attendance by venue.
Scroll through the live dashboard views TreeClimb uses to keep operational detail and group performance in the same conversation. Figures are masked for sharing.
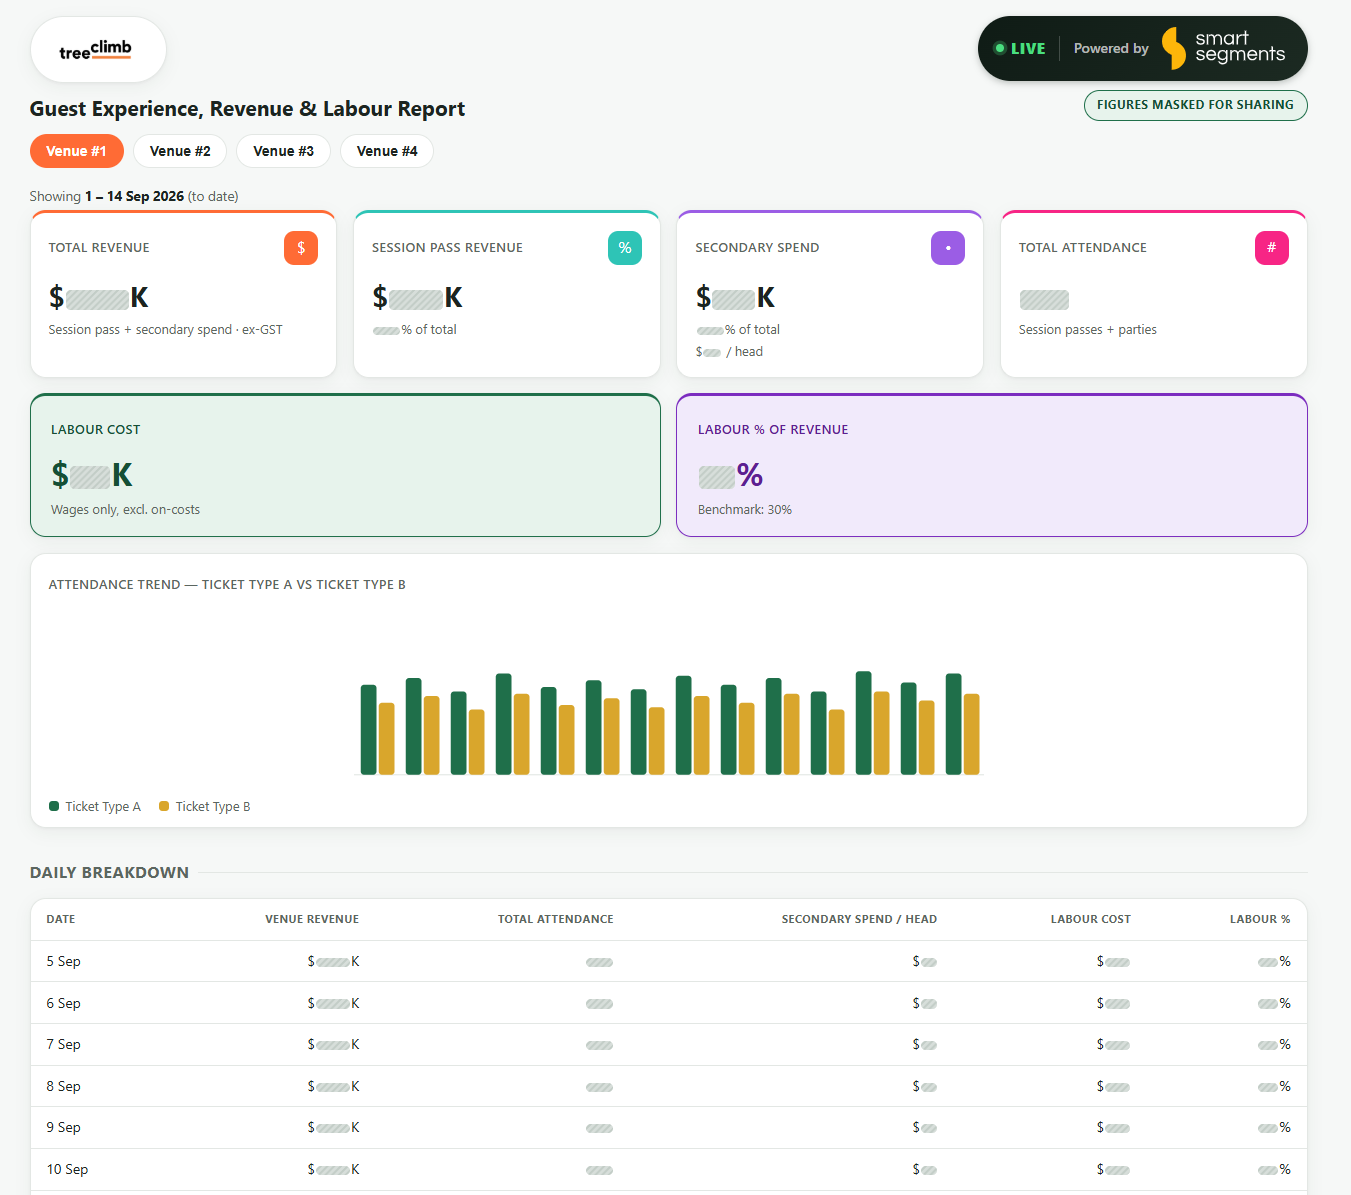
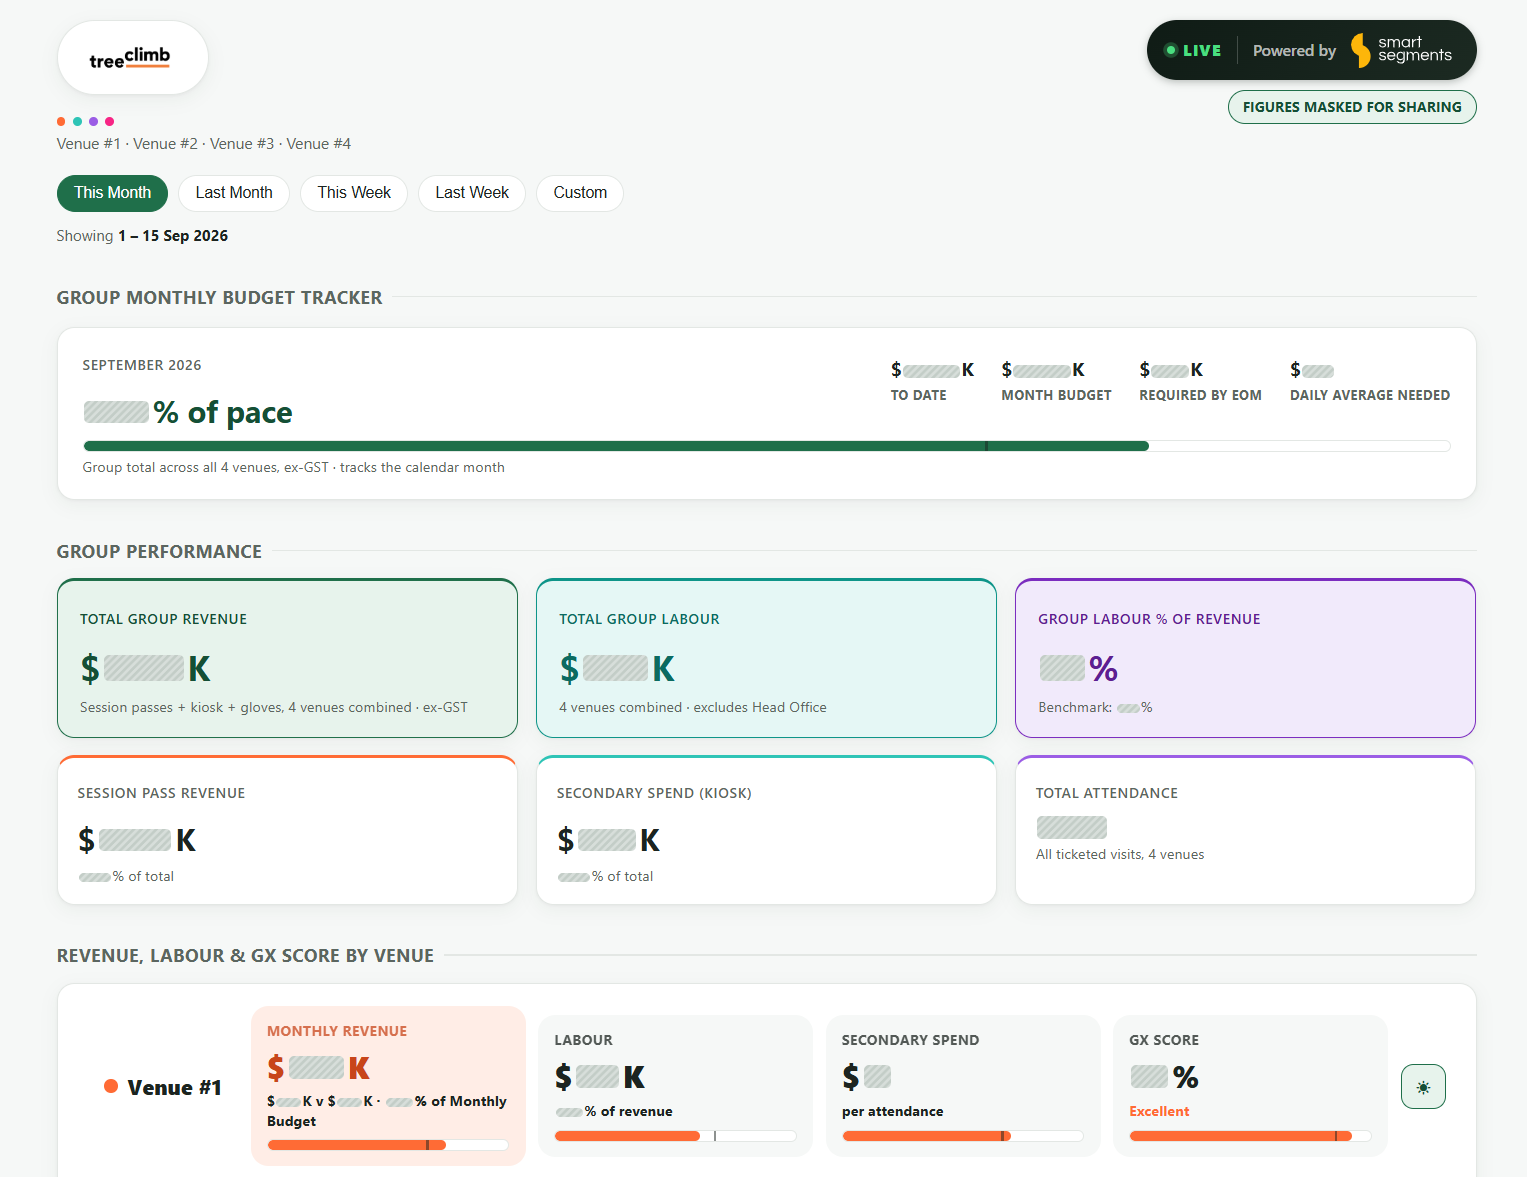
Every time I ask Claude a question, I know the answer's accurate — because it's tested.
Jake Cunningham — TreeClimb Group
A scheduled report checks yesterday's numbers each morning, updates the dashboard and publishes a fresh file straight to TreeClimb's OneDrive, in the right folder, automatically.
The underlying logic was reverse-engineered against TreeClimb's own Finance-reported P&Ls until it matched exactly, so every number is one the team already trusts.
Connect the events your venue already captures to the questions, dashboards and scheduled reports your teams want to run.
Venue360 connects the systems your venues already run, so Claude can work from a consistent foundation and your teams can trust the answer they get.
Bring your current reports, questions and operating context. We’ll help map the next useful step.