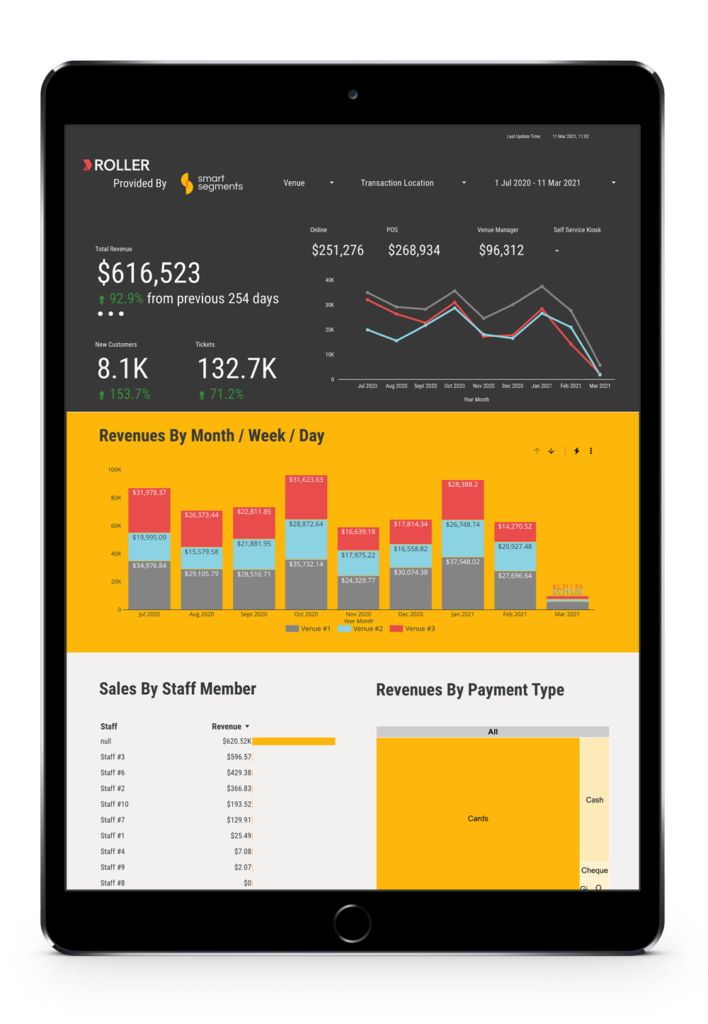
Eliminate managing countless CSV files and unify specific ROLLER data.

Multi-venue management can face a lack of visibility and transparency when managing data overload from various sources. Automated data transfers into customisable reporting and analytic dashboards integrated with ROLLER provides a unified view of key performance indicators (KPIs), financial data, sales and marketing activities.
With Smart Segments ROLLER BI Dashboard, build your own customised and automated reporting dashboards with ROLLER and other venue data sources such as, PowerBI, Google Data Studio, Google Sheets and Excel. Eliminate missed opportunities, time-consuming analysis and enable real-time data-driven decisions for improved efficiency while optimising business performance.

Interactive elements and visualization charts promote data exploration to enable managers to gain deeper insights. Colors can represent different levels or values, allowing users to quickly identify areas of high performance, low performance, or anomalies.

View and analyze data across multiple venues. Streamline performance analysis and informed decision making. Create custom reports that display the critical information relevant to the individual stakeholder.

Customise dashboards and improve overview of venue performance by combining ROLLER data with other venue data sources such as Power BI, Google Analytics, CRM platforms or location weather data.

Identify opportunities to increase sales or reduce costs by monitoring and tracking KPIs in one place. Analyse guest bookings and memberships, revenue pipeline, guest service issues and marketing campaign performance.
Say goodbye to information silos, manual data mining and gut-feeling guesswork, and feel confident in your decision-making processes. Join our mailing list to start your journey towards becoming a data-driven leader in your industry.


© 2023 Smart Segments All Rights Reserved.