Leverage Your XERO data By connecting It with the Rest of Your Business With the BigQuery Connector
Power your sales and operational teams with custom BI dashboards directly from XERO. Gain valuable insights and be “in the know” about your business performance anytime and anywhere.
The Smart Segments XERO to BigQuery Connector
Enlightens Business Teams Through High Quality Data Sharing
Supercharge Sales and Marketing
Set targets for your Sales and Marketing teams and allow them to monitor their performance in realtime BI Dashboards with the highest quality of Data from XERO, while giving them access to only the data relevant to them.
Optimise Operations
Keep your operational teams informed and motivated with cost and performance dashboards with data directly from XERO. Help the team to optimize their operational responsibilities by unlocking the knowledge and power of your Xero data.
Mitigate Risk through Automation
Integrate and automate your XERO data by setting up automated triggered emails when liabilities reach a certain treshold or when costs increase too fast.
Easy, Secure Installation
Install the XERO to BigQuery connector in just a few clicks. The connection will automatically load and schedule your XERO data to feed into your own secure BigQuery Data Warehouse on an hourly basis.
Optimise your operations with customised business intelligence reporting using your ROLLER data.
Your XERO data is like electricity. Sharing it across your business will light up your teams performances. The more information is shared the more knowledge is gained.
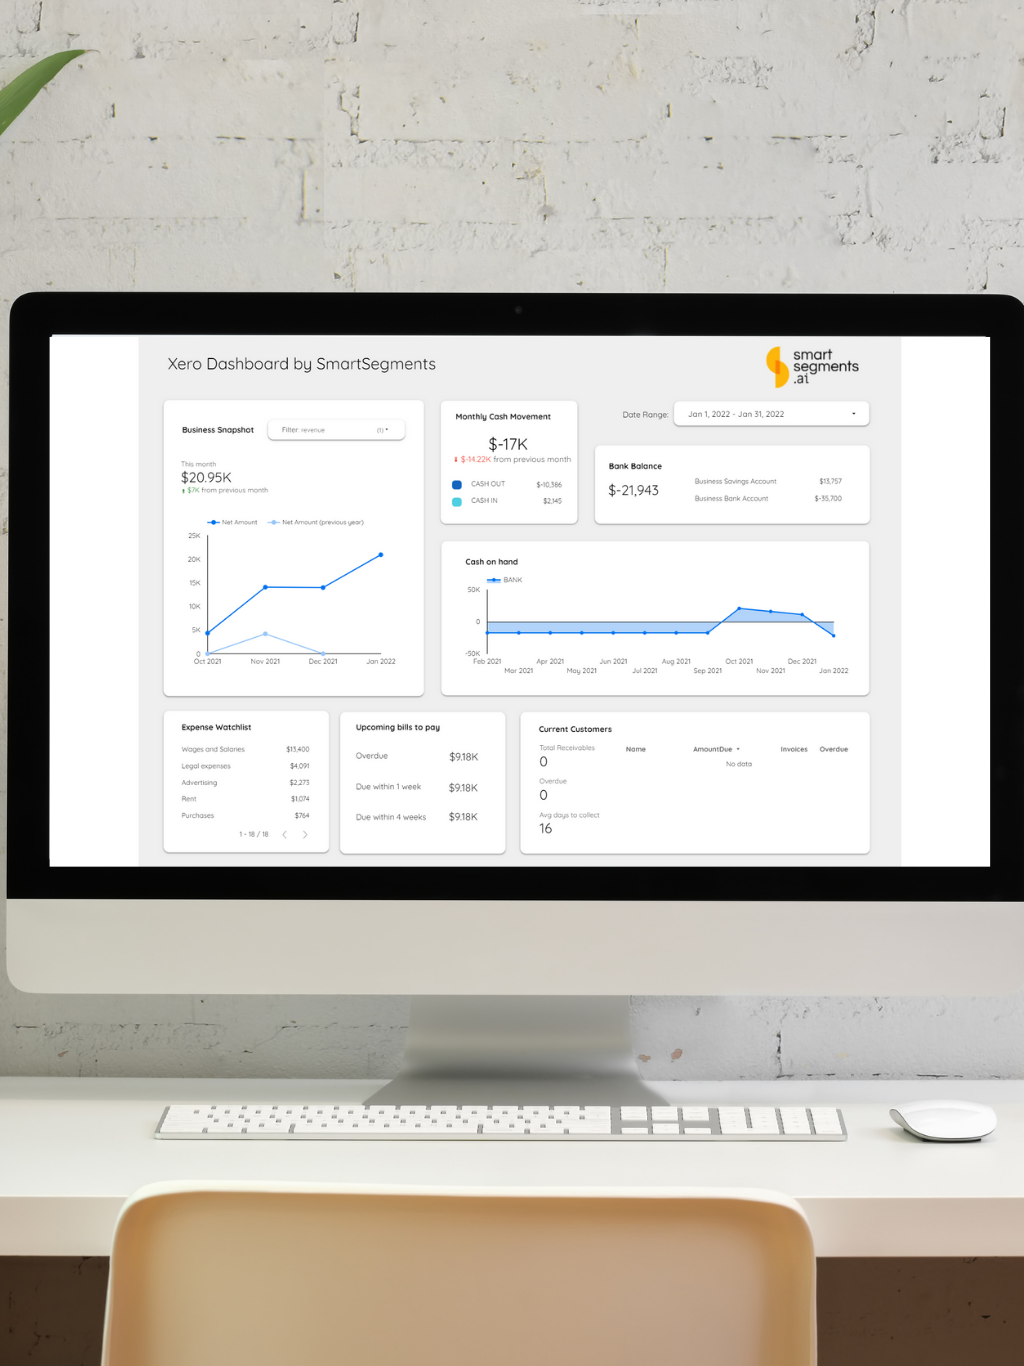
Create custom dashboards, or start visualising data today with our free dashboard download
With our XERO connector, you can choose to build your own customised, automated and secure BI dashboards with your XERO data using your favorite BI tool such as PowerBI, Google Data Studio, Google Sheets, Excel or most other BI systems.
“ I use the XERO connector with Google Data Studio to securely collaborate and work with the XERO data with different teams across my multiple businesses. What I praise about the connector is its security, robustness and flexibitlity that now allows us to work with the XERO data across different systems and with different teams ”
Owen Mullins
Owner
APAC Digital
” I use Google Data Studio to visualize my P&L report in line and bar graphs. This gives me a visual understanding of my business performance. With the Smart Segments connector I was able to create this Dashboard in a few clicks. “